Behind every piece of verbal communication, there is a set of emotional messages, which are crucial for understanding the meaning hiding behind the text. That’s where sentiment analysis, also called opinion mining or emotion detection, comes in. It is used to determine the opinion, emotions and attitude of a writer.
In this article, we’re going to take a closer look at one of the tool’s business applications: social media analysis used to check the reception of a certain topic or the writer’s opinion orientation. We’ll do so by analysing the examples of sentiment analysis applications for Twitter-based data using two NLP frameworks.
Ready to explore how technology can help to understand what hides behind user opinions? Let’s dive in!
What is Natural Language Processing?
NLP is the automatic manipulation and understanding of written or spoken text. It intersects such fields as linguistics and artificial intelligence. It originated in the previous century in the ’50s from Alan Turing’s paper in which he introduced an Artificial Intelligence-related concept by asking a question: “Can machines think”?
Throughout the last 70 years, this concept has rapidly evolved into tangible methods and automated tools capable of quickly answering quite complicated questions, mimicking human reactions.
The benefits of NLP for business
Now you may and should ask: what does this have in common with my business and its performance? The short answer is simple: a lot!
First of all, NLP methods have a wide range of business applications. They can be used to monitor customers, user behaviour and opinions from customer feedback, as well as survey, social media posts, chatbot conversations, and emails.
The benefits NLP can bring are many. We can learn more about user needs, tailor products and services, improve customer service, react in real-time and over time on social media. Thanks to sentiment analysis, we can also detect fake news, delete offensive comments, and therefore prevent cyberbullying.
How can we deliver sentiment analysis solutions?
There are a lot of automatic and business-friendly NLP frameworks. But how to know which one is the best for you? Let’s go through the overview of those most suitable for sentiment analysis.
From a technical point of view, we can implement Sentiment Analysis as SaaS or open-source APIs. SaaS frameworks are ready to use and do not need advanced programming skills. Open-source packages, on the other hand, are flexible, have much more customisation possibilities, are free to use and can be deployed on-premise.

Amazon Comprehend
Amazon Comprehend is a cloud SaaS solution that uses NLP to extract insights about the content of documents. It develops insights by recognising the entities, key phrases, language, sentiments, and other common elements in a document.
For example, by using Amazon Comprehend you can search social networking feeds for mentions of products or scan an entire document repository for key phrases.
Amazon Comprehend determines the emotional sentiment of a document: it can be positive, neutral, negative, or mixed. This solution is a cloud service that can work serverless. For more AWS Machine Learning solutions, please see our article.
More NLP-based frameworks
Apart from Amazon Comprehend, there are several open-source frameworks available, such as Python’s NLTK, TextBlob, Gensim, SpaCy, Core NLP, that can be applicable for sentiment detection.
NLTK is probably the most popular and as it was released the earliest. For the purposes of our case study, we used TextBlob: a Python library for processing textual data that is based on NLTK. It provides a simple API for diving into common NLP tasks such as part-of-speech tagging, noun phrase extraction, sentiment analysis, classification, translation, and more.
TextBlob has a rule-based integrated sentiment analysis function with two properties – subjectivity and polarity. Polarity has a continuous value in a range from -1 to 1, where -1 is a negative sentiment, +1 positive and around 0 is neutral. Subjectivity is in a range from 0 to 1 where 0 is very objective and 1 very subjective sentiment.
Twitter has become one of the most important sources of opinion forming, and it is a great source of concise text that expresses emotions, which makes it perfect for sentiment analysis. Let’s see how it’s done!
We started with data collection. Our data set consisted of about 2,200 tweets pulled out using Tweepy – a Python library for accessing the Twitter API. Relevant tweets were collected using Search API.
As an example, we took social media posts from a well-recognised and emotion-inducing brand – Tesla. We wanted to know what are sentiments hidden behind tweets hashtagged with the “tesla” keyword.
We looked at tweets from 18 days, between 10 and 28 December 2020 and included only original tweets (retweets, replies and links were excluded) in English. The information extracted was:
- text of the tweets
- the date and time they were posted
- the number of likes and retweets
- the tweets’ source (different devices and bots)
- the location (country)
We performed sentiment analysis using both Amazon Comprehend and Python TextBlob APIs. With the information we gathered, we could check how popular the tweets were and what was the sentiment behind them.
By using different filters, we could also and examine only e.g., negative sentiment or most popular tweets, do some aggregations per a specific time period, browse data by location or by the device from which it was posted.
The power of visuals
Looking at raw tweets data and analysis outcomes is time-consuming, might be confusing and may cause key information oversight or misinterpretation. At-glance reporting together with adequate visualisation techniques helps to understand business data better, by showing only the relevant information and reducing the clutter and getting actionable insights.
For the purpose of this article, we have used Power BI to customize and summarise outcomes. We put the information about the tweets and both sentiment analysis methods results on three separate dashboards.
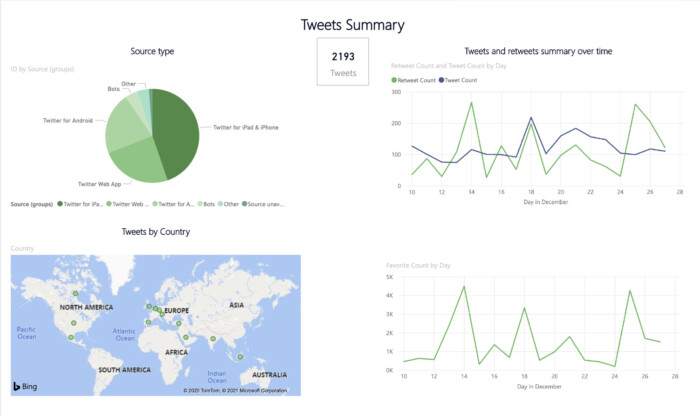
In the tweets summary, dashboards showed how much people talked about the brand by including the number of likes and retweets, the device from which it was posted and location.


Key findings
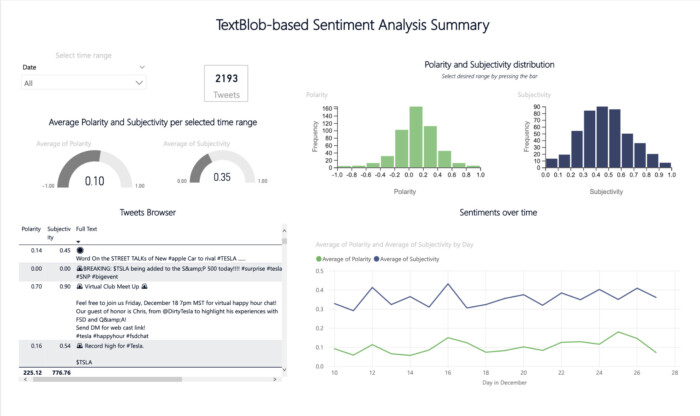
The overall tweets summary shows that in general they have a positive reception and are rather objective.
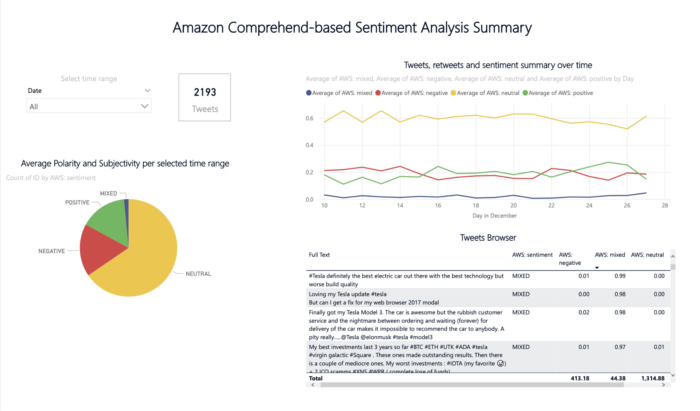
Both polarity and subjectivity had normal-like distribution, which means that there were a limited number of extremely negative or positive posts in TextBlob outcomes. The same results were visible in Amazon Comprehend results – the great majority of tweets were classified as neutral.
In the next two dashboards with sentiment summary, the main functionalities are date lookups, the ability to filter on polarity values or categories, select specific tweets in the browser and display sentiment mean values.
What can we say about the posted tweets?
- Most tweets were posted using mobile devices, both for Android and iPhones (65%). The Twitter Web App was used for 24% of analysed tweets. About 4% were posted using bots. Looking at the average polarity, we can say that only these posts with unavailable sources were slightly negative.
- When looking at the timeline we can see that December 18 was the day with the highest amount of tweets, more than 200. This is most likely due to the fact that it was the last trading day for investors before Tesla officially was added to the S&P 500 index on Monday, December 21.
- Regarding the tweets’ location, it looks like the USA and Canada have the most active tweeters. However, the sample was so small that we can tell much about location distribution. This is just an example of how presenting data on a map makes it easier to understand.
Summary
In this post, we showed two sentiment analysis packages. TextBlob, an open-source Python library and Amazon Comprehend cloud-based SaaS. We also presented their outcomes on a dashboard in a user-friendly way. We hope you enjoyed the article and found the information useful!
Trying to decide on sentiment analysis tools adjusted to your business requirements? Browse our AI development services and find the one suited to your needs.
What is the main purpose of sentiment analysis?
The main objective of sentiment analysis is to better understand your customer and their view of your brand, product, or service. By analysing the emotions or opinions contained in the text, we can understand the customer’s feelings and needs much better. Sentiment analysis allows you to respond better to feedback from your product users and to react more quickly to negative emotions. An essential aspect of sentiment analysis is monitoring how your brand is perceived. This is all aimed at improving your customer’s perception. Sentiment analysis, in turn, will help to customize your offer better and, in the long run, impact your business’s growth. It is, therefore, a tool that affects not only your product’s development but also your brand’s PR.
What are the main stages of sentiment analysis?
There are four main steps in sentiment analysis:
1. Data collection – logically, without data we are unable to carry out any analysis. We can collect data everywhere – mainly through social media, but also through reviews on Google or using special tools for sentiment analysis like Sentione, Brand24, Brandwatch and more.
2. Preparing the text for analysis – we remove from the text any words which are not helpful in the analysis – stopwords such as and, or, but, additionally, we remove punctuation marks or strip the word to its stem (e.g., by using suffix-stripping algorithms that remove the “ing” if the term ends with “ing”).
3. Analysis of the collected data – finally, we can analyse the collected data. Depending on the tool chosen, the result of the analysis may be zero-one (positive-negative) or include a spectrum of different emotions, e.g., anger, sadness, joy, etc.
4. Interpretation of the data – in this last step, we try to understand the results obtained, find relevant correlations, and implement changes based on them.
What are the best tools for sentiment analysis?
A good tool is fundamental in sentiment analysis. This is because a well-chosen solution will do all the work for you, leaving you only with the final analysis stage – the data interpretation. There are many good sentiment analysis tools, both open-source and SaaS. If you prefer SaaS solutions you can use tools such as: Amazon Comprehend, Hubspot Service Hub, MeaningCloud, MonkeyLearn, BrandWatch, and Lexalytics. However, if you prefer open-source solutions, you can use NLTK, TextBlob, ScaCy, or Stanford Core NLP. The choice of the right tool depends on your preferences and how detailed you want to obtain the results of this analysis. Some solutions propose a zero-one analysis (positive or negative), while others present the whole spectrum of emotions like joy, anger, or sadness.
How can sentiment analysis be used to improve customer experience?
Sentiment analysis allows you to gather honest feedback directly from the customer, understanding their emotions about your brand or product. You can gain insight into the client’s feelings, making it much easier to take their perspective. You have access to the most valuable data – the actual impressions of the user about your product. So you don’t have to improve your product based on a gut feeling and clutching at straws. Sentiment analysis is what has a real impact on improving the user experience. This, in turn, enables you to customise your product, its continuous improvement, and influence customer engagement.


