Smartphones generate most of the global web traffic and account for a big chunk of global purchases. No wonder that eCommerce owners are increasingly focusing on refining their mobile strategies. Desktops are slowly losing their prominence, giving way to mobile interfaces, a trend that will strengthen in the coming years.
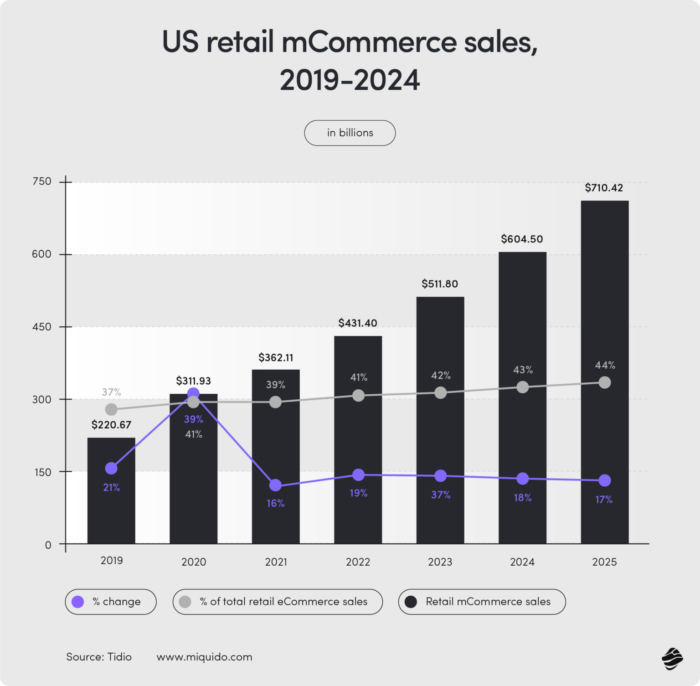
These estimates do not come from a crystal ball. We are not reading the tea leaves, but the numbers – and they say it all! According to data from Tidio, by 2024, mobile commerce sales will reach $710 billion, growing almost double since 2021 ($362.11 billion).
Mcommerce Statistics: Mobile Dominance in eCommerce
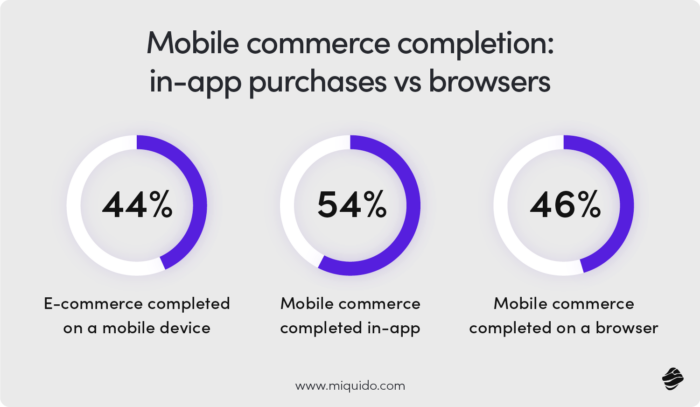
Mobile’s dominance in eCommerce becomes especially evident during major shopping events. For example, during Cyber Week, more than half of all online sales come from mobile devices (Mobiloud). We love shopping and paying through our phones – 44% of eCommerce payments are completed on a mobile device (JP Morgan). This is a clear signal to business owners to invest in their mobile tools.
For eCommerce, this shift toward mobile can be a challenge, but also an opportunity, which our article will help you use. No speculating, just pure numbers – let’s delve into mobile commerce statistics from various angles and draw conclusions that will elevate your mobile strategy!
USA, Europe, UK: Comparing Mobile Commerce Statistics Across Different Regions
Mobile’s having a momentum – all three markets saw significant growth in 2023. The UK stands out as a mobile leader – already in 2022, mobile purchases accounted for approximately 55% of online retail sales in the region (Octal Software). In comparison, in the USA, it was 41%, with forecasts of 44% by 2025.
In Europe, there are major differences between countries, some quite surprising, considering overall tech tendencies. The UK is at the forefront, but there are countries like Poland (Mordor Intelligence), where despite advanced technological development, shopping through laptops and desktops dominates.
Mcommerce Statistics: Variations in Mobile Payments
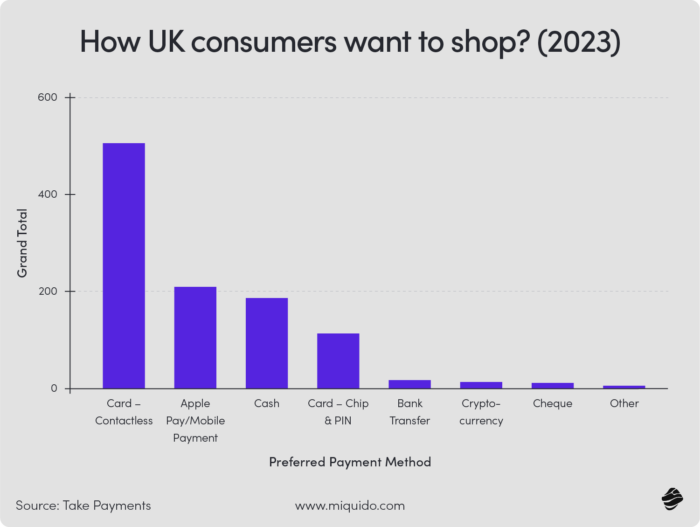
Interestingly, a strong gap is visible in the sector of mobile payments. In the USA, contactless payments became widespread much later than in Europe or Australia. Similarly, tap-to-pay via smartphone was only enabled by JP Morgan for iPhone users last year. In comparison, European banks like ING Bank Polska and Millennium Bank introduced tap-to-pay payments in 2017.
Mobile Commerce App Statistics: User Behavior Trends in Mobile Shopping
No matter which region you look at, mobile shopping is on its way to matching or even surpassing desktop shopping. The growing share of mobile apps (cross-platform apps or native for mobile) in total digital sales is noteworthy. In the United States, it is already 47% and constantly growing.
This growth is not only due to changing user habits but also the rising accessibility of mobile apps. Business owners pay more attention to adapting interfaces to mobile users’ needs, who, in response, are more eager to use them. And so, the circle is complete.
Users especially reach for mobile apps during sales peaks, a valuable insight for all eCommerce businesses. According to Retail Dive, in 2021, 55% of mobile users downloaded at least one new mobile commerce app before or during the holiday season.
During these times, we search and shop more intensely – no wonder we want to have apps at hand. If you aim for higher margins and conversions, it’s worth promoting your mobile app around holidays, vacations, and other sales peaks (depending on your industry). These mcommerce statistics are the best proof. Use personalized notifications to help your users secure the best deals.
Impact of Mobile Optimization on eCommerce Websites
A non-mobile-friendly eCommerce website is a faux pas, and worse, a potentially lost sales opportunity. Statistics from Google confirm the significant impact of mobile user experience on conversion and the overall relationship with the brand. It might surprise you how crucial it is!
Even if users like the business, 50% of them will use the website less if it is not mobile-friendly. The statistics are even more concerning for business owners: 61% claim that if they don’t find what they are looking for right away on a mobile site, they’ll quickly move on to another one.
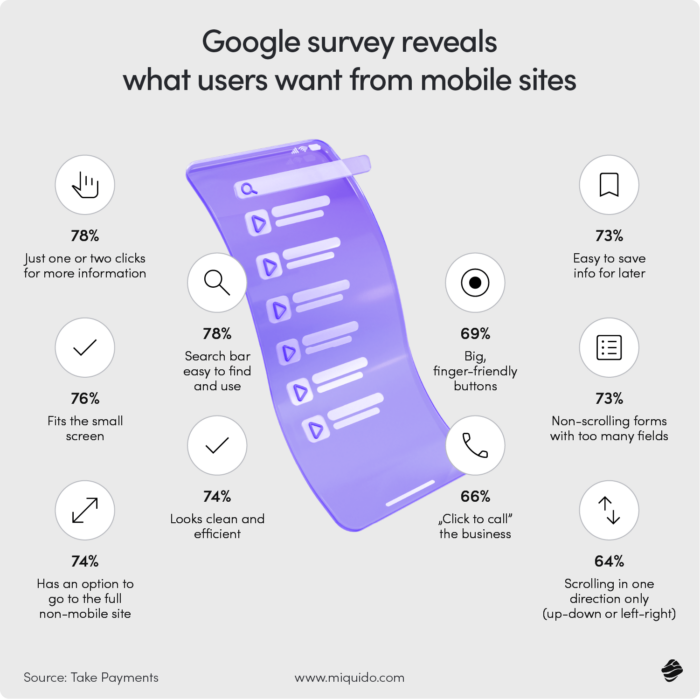
A non-mobile-friendly website has both short-term consequences and long-term impacts on the brand image. According to Google’s research, for many users, it’s an emotional matter: 48% feel that a company that doesn’t adapt to smartphones doesn’t care about their business. And that can be a turn-off even for the most enthusiastic shopper.
Here’s the takeaway: optimize the interface and implement eCommerce app features that are easily adaptable in both desktop and mobile. Don’t let anyone feel left out!
Role of Mobile Apps in eCommerce Sales Compared to Mobile Web Browsers
Mobile apps simplify many processes that remain unoptimized in mobile web versions. Key processes for churn and cart abandonment rates, such as checkout and payment, usually involve fewer steps and avoid problems caused by touch navigation. This explains why 54% of mobile commerce payments happen in an app (Tidio), with the remaining 46% through mobile web browsers. Additionally, mobile apps have a conversion rate three times higher than mobile websites (MarketSplash).
Mcommerce Statistics: Mobile Shopping and Conversion Rates
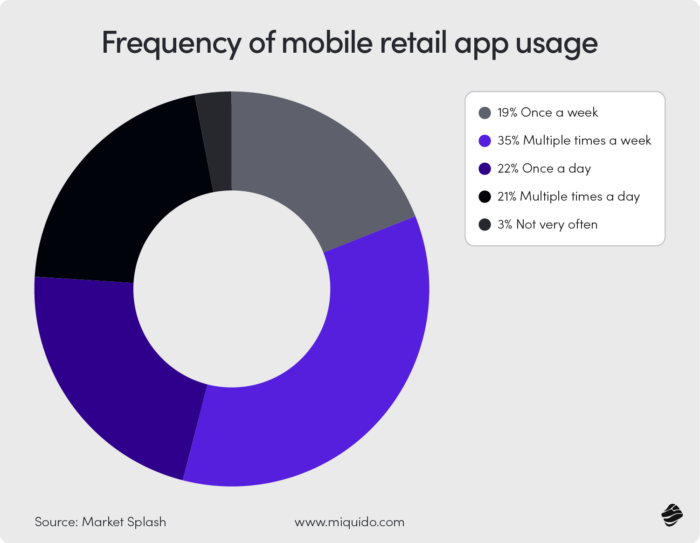
Mobile shopping often happens on the go, so you have to make the most of your sales opportunity whenever it appears. However, the constant accessibility of your smartphone also creates favorable conditions for impulse actions. This can mean higher conversion, a holy grail for every business owner. Did you know that smartphone conversion rates are, on average, 64% higher than desktop conversion rates (Forbes)?
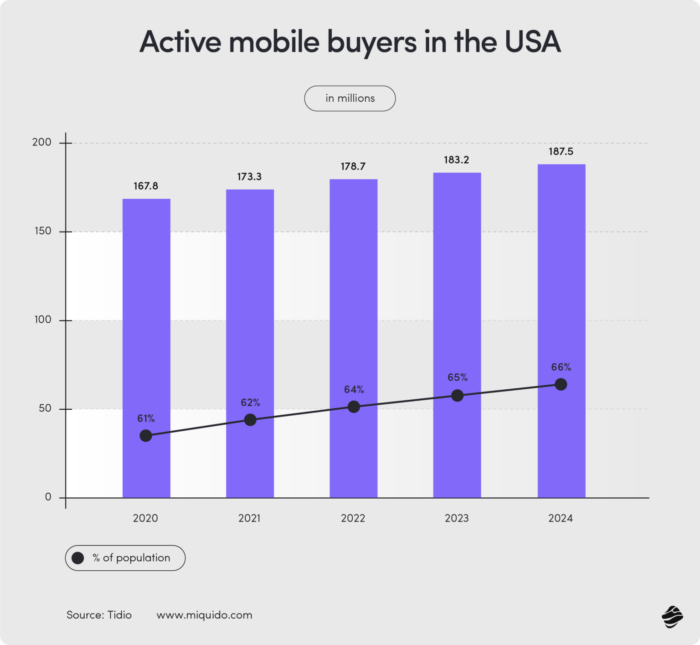
A polished app doubles your chances for high sales metrics. App users view 4.2 more products on average compared to those on mobile browser sessions. Provide them with what they are really looking for (AI can help with that), and a full cart is guaranteed!
Mobile Commerce App Statistics: Security Concerns and Measures to Enhance User Trust and Safety
As mobile devices continue to capture a larger share of global online traffic and eCommerce sales, they increasingly become a lucrative target for hackers. According to Kaspersky’s data, in 2023, the increase in the number of attacks on mobile devices reached 50% compared to the previous year, with almost 33.8 million attacks. Interestingly, adware was responsible for 40.8% of these threats, despite many mobile users primarily relying on applications rather than browsers.
Vulnerabilities in Mobile Apps
This doesn’t mean that apps are a safe haven. A common reason for threats in mobile apps is vulnerabilities in open-source code embedded in the software. Therefore, it’s crucial to use tools and methods that detect vulnerabilities in open-source components since the earliest stages of eCommerce software development. This not only prevents potential data breaches but also avoids costly interventions in already developed code.
User Education and App Store Security
Educating users is also key. Even if you secure your app internally, cybercriminals can outsmart your customers by offering fake versions of the app. This practice is common not only in unofficial but also official app stores, like Google Play. Kaspersky experts observed numerous malicious applications infiltrating this store in 2023.
Hence, it is crucial to monitor app stores closely, at least the official ones, and raise awareness about recognizing the legitimate version of the app through official announcements or push notifications. Don’t become another number in the cyber breach mobile commerce statistics – take proactive steps to protect your customers!
The Influence of Emerging Technologies like AI and AR on the Mobile Shopping Experience
Business owners, especially those targeting the US market, should not ignore voice assistants—in fact, incorporating them into their strategy is crucial for success. 50% of U.S. mobile users use voice search daily (Forbes), with steady growth each year. Optimizing your content and navigation for voice search can significantly increase purchase opportunities. Rich featured snippets and long-tail keywords are a must in this respect.
Generative AI and eCommerce
The revenue from generative AI services is predicted to reach $188 billion by 2032 (The Brainy Insights). As generative AI develops, AI assistants’ capabilities grow—they can not only assist with searches and answer simple questions but also support users in more creative tasks.

Multimodal AI Assistants
More eCommerce companies are incorporating multimodal AI assistants, which perform well in both text and voice interactions and handle various content types. These assistants are shaping new customer expectations for shopping experiences, especially on mobile. Mobile commerce app statistics show that integration with generative AI in eCommerce will become a standard, and to stand out from the competition, stores will refine their models to earn customer trust through tone-of-voice and precision. The closer to real-life shopping experience, the better!
AR in Mobile Apps
Moreover, more companies are including AR in their mobile apps, as seen with IKEA and ASOS. This requires seamless real-time integration with computer vision systems and generative AI features, enabling users to try on items or place them in a visual representation of their home environment. Dive into their use cases in our blog post about the benefits of mobile commerce.
Turn Our Mobile Statistics for Your Mobile Success
As specialists in mCommerce app development, we can help you turn these insights on mobile commerce statistics into a high-converting application. As the statistics above confirm, the mobile sector is only going to grow, so it’s worth optimizing now. Mobile app development services are our forte – we have created mobile applications for Play, Abbey Road Studios, Empik Go, and Nextbank, among others.
You could be next! If you first want to learn what is mobile commerce and discover best practices in this area, check out our blog. Let’s stay in touch!


